Zeiler M D, Fergus R. Visualizing and understanding convolutional networks[C]//European conference on computer vision. Springer, Cham, 2014: 818-833
1. Overview
1.1. Factors of DL
- big data
- GPU
- model regularization strategy (dropout, …)
In this paper, it proposed a visualization technique to explore the network - unpooling
- the horizontal and vertical of Conv kernel
1.2. Dataset
- ImageNet 2012
1.3. Visualization Method

Unpooling→Rectification→Filtering (horizontal and vertical corresponding Conv kernels)
1.4. Network

Change based on AlexNet.
1.5. Feature Visualization
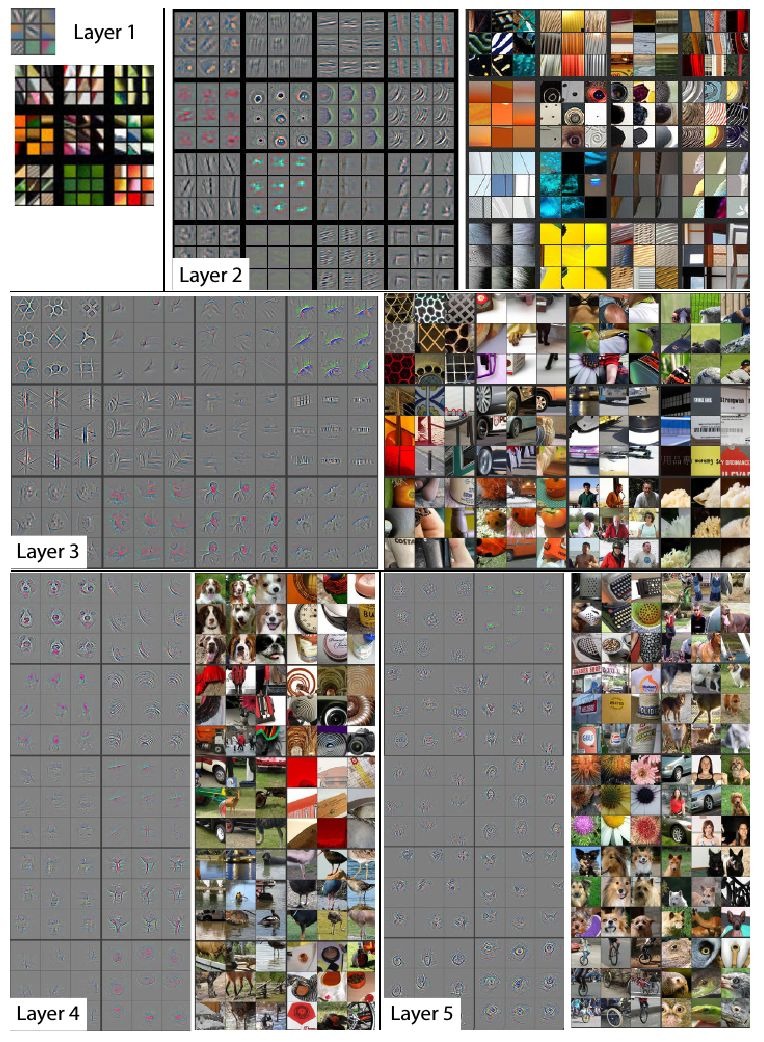
- Layer2. corners, edge/color conjunctions
- Layer3. texture (more complex invariances)
- Layer4. significant variation (more class-specific)
- Layer5. entire obj with pose variation
1.6. Feature Evolution during Training

- lower layers. converge within a few epochs
- upper layers. converge after a considerable epoch
1.7. Feature Invariance

- small transformation dramatic effect in the first layer, less impact at the top layer
- not invariant to rotation, except for the obj with rotational symmetry
1.8. Architecture Selection

- (b). mix of extremely high and low frequency information, with little converage of the mid frequency, and some dead features
reduce 11x11 kernel size to 7x7 - (d). aliasing artifacts caused by large stride 4
change stride 4 to stride 2
1.9. Occlusion Sensitivity

1.10. w/o Pre-trained
